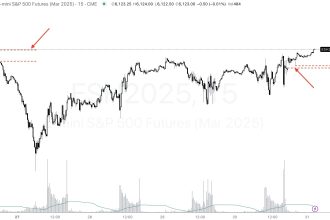
In technical analysis, Round Tops and Round Bottoms are classic reversal patterns used to identify trend changes in price movements. These patterns are characterized by gradual, arc-shaped formations that signal a shift in market sentiment from bullish to bearish (Round Top) or bearish to bullish (Round Bottom). Below is a detailed breakdown:
1. Round Top
Key Characteristics
- Shape: Forms a downward-curving arc at market peaks. Price rises gradually, slows to a halt, and then declines slowly, creating a smooth, rounded top.
- Volume: Typically decreases during the upward phase and may increase slightly as selling begins. Volume often surges when price breaks below the “neckline” (the support level connecting the lows of the arc).
- Market Psychology: Reflects weakening bullish momentum. Buyers gradually lose control as sellers accumulate positions, leading to a gradual trend reversal from uptrend to downtrend.
Trading Implications
- Confirmation: The pattern is confirmed when price breaks below the neckline, signaling a sell opportunity.
- Price Target: The projected downside target is roughly equal to the vertical distance from the arc’s highest point to the neckline.
2. Round Bottom (Cup Formation)
Key Characteristics
- Shape: Forms an upward-curving arc at market bottoms. Price declines gradually, stabilizes, and then rises slowly, creating a “bowl-like” bottom.
- Volume: Decreases during the downward phase and remains low at the bottom. Volume typically increases as price starts to rise and surges when breaking above the neckline (the resistance level connecting the highs of the arc).
- Market Psychology: Indicates fading bearish pressure. Sellers exhaust themselves, allowing buyers to gradually take control, shifting the trend from downtrend to uptrend.
Trading Implications
- Confirmation: The pattern is confirmed when price breaks above the neckline, signaling a buy opportunity.
- Price Target: The projected upside target is roughly equal to the vertical distance from the arc’s lowest point to the neckline.
3. Key Differences: Round Top vs. Round Bottom

4. Important Considerations
- Formation Timeframe:
- These patterns develop over weeks or months, requiring patience to avoid mistaking short-term fluctuations for reversals.
- Neckline Validation:
- A valid breakout/breakdown must be confirmed by volume. Weak volume may indicate a false signal (e.g., price briefly piercing the neckline before retracing).
- Combine with Other Tools:
- Use complementary indicators (e.g., moving averages, RSI, volume trends) to strengthen signals. For example, a Round Bottom with rising volume and bullish RSI divergence is more reliable.
- Market Liquidity:
- Round patterns are most effective in liquid markets (e.g., major stocks, forex pairs). In low-volume markets, they may form due to manipulation or low trading activity, reducing their validity.
5. Conclusion
Round Tops and Round Bottoms represent gradual, sentiment-driven reversals, contrasting with abrupt “V-shaped” turns. They highlight the slow erosion of bullish or bearish momentum as control shifts between buyers and sellers. Traders use these patterns to anticipate trend changes, but always pair them with volume analysis and cross-validation across timeframes to avoid false signals. As with all technical patterns, they are most powerful when aligned with broader market fundamentals and trend structures.
Interpretations of other chart patterns are available in chart patterns